Next: Model input files Up: Running default scenarios Previous: Running default scenarios Contents
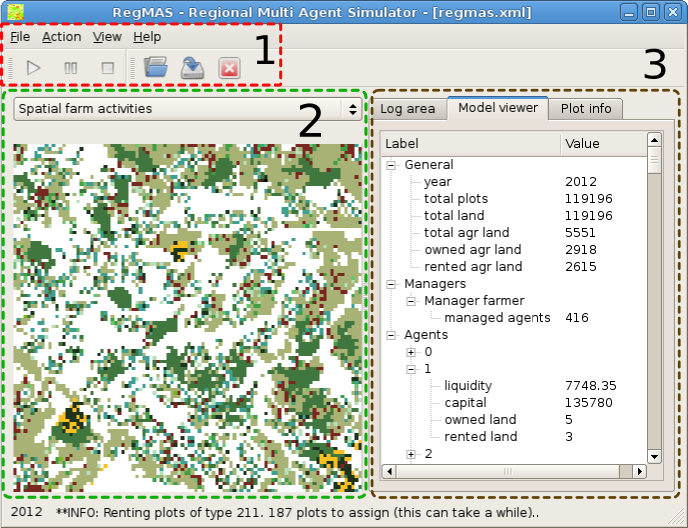
The first area includes the COMMANDS, divided into the action toolbar and the file toolbar. From left to right, they allow to run the model, to pause it, to permanently stop the model, to load a new model, to save a model log and finally to exit the program.
Even if we checked the code very accurately, it is not advisable to run several simulations consecutively. This because memory leaks are likely to arise and in the worst scenario to interfere with the model. Instead, users can close the program and re-open it at each newer simulation.
The second area displays the MAPS (spatial layers) that are loaded or drawn by the model. They are upgraded at least once for each simulation year, and are the quickest way to see what it is happening on the model during run-time. Layers can be switched using the drop-down menu at their top and can be zoomed or scrolled using the mouse. Maps can always set back to fit the window using the Fit map in Window command from the View menu.
The third area is a multi-page QUANTITATIVE VIEWER. At present, three pages (tabs) are available. The first page displays the MODEL LOG, and its content can be saved as a text file during simulation or at its end. The central tab acts as a MODEL STATUS VIEWER. Again, it helps to check the status of the model while still running, this time more quantitatively. It provides information on the general region, on each agents-manager (the individual agent that ''manage`` all agents of its type) and, if the region is small, on each individual agents10. Finally, the third tab displays a cross-layer PIXEL INFO AREA. It is activated right-clicking over a plot and it displays its value across all the layers, the current one being highlighted.
Regional Multi Agent Simulator 2011-06-19