Next: Advanced: changing RegMAS structure Up: RegMAS User Manual Version Previous: Creating new scenarios Contents
While RegMAS ships with a default region that can be used for simulation purposes, most likely users want to run simulations over their own case-study regions.
In order to be modelled with RegMAS a region must be available with the following set of data:
The basic idea is to reproduce in the model a simulation region composed only of ``typical'' farms, but of which aggregate values are as close as possible to the real one.
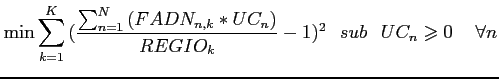
To each farm in the region of which detailed data is available (e.g. because the farm is member of the FADN network) is associated a coefficient. A 0-coefficient means that the farm is not selected, while a non-0 coefficient implies that the farm becomes one of the typical farms of our simulation region. The key point is to find these scaling coefficients that minimise the difference between the simulation region and the real one (Eq. 4).
| Indeces: | Variables: |
|
|
|
|
|
|
This procedure is called "upscaling" and it is well documented in Kellermann et al. (2007), while a practical implementation is discussed in Sahrbacher et al. (2005)13.
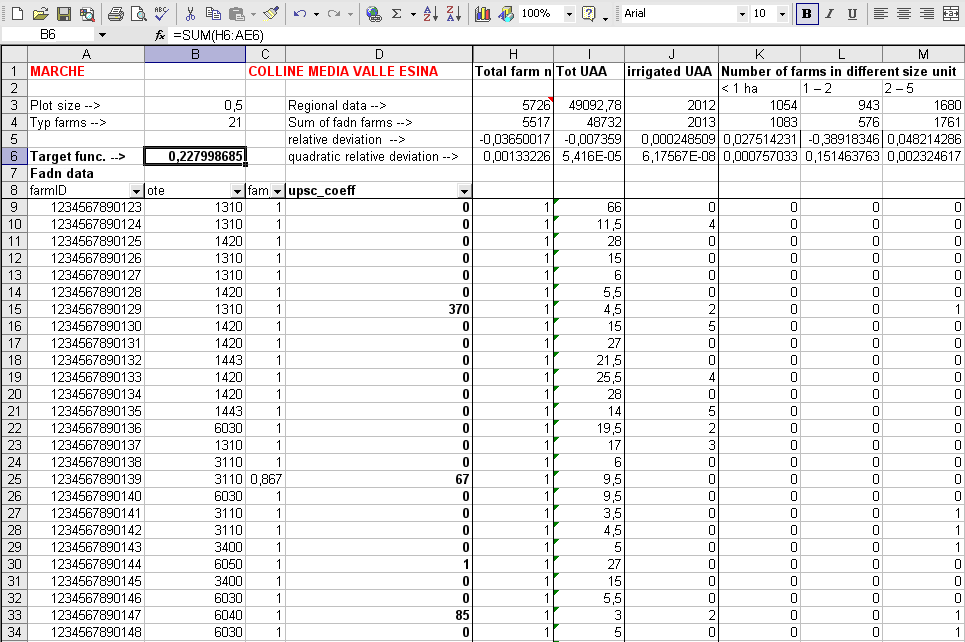
The upscaling can be conveniently obtained using the quadratic solver in Excel, like shown on Fig 6 14