Next: Exporting results to a Up: Model output Previous: Spatial results Contents
Furthermore similar results are available for farmers that leave the agricultural sector.
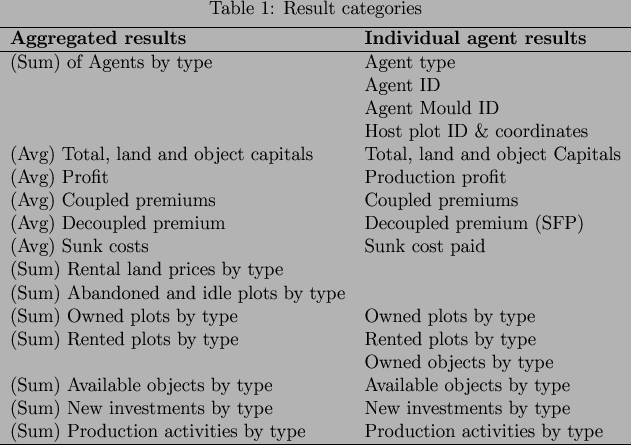
Most data is collected trough a ``survey'' that each agent is asked to fill, more or less how it happens with real statistics.
Rental prices are updated from the previous year (or, on the first year, from initial renting prices) only if in the model there are at least 5 new contracts for that specific soil type.
Abandoned plots sum two different kind of plots: those owned or rented by an existing farm but not utilised at all, and those owned by a farm that left the model and that are srill unrented.
The difference in the detailed data between owned and available objects is due to the fact that agents may have rented plots including spatial objects that are not in their property basket but that thanks to the renting contract become available to their production activities: the formers are important in the capital formation, the latter to the production decisions.
On both the aggregated and the detailed results the ``activities by type'' values refer to the results arising form the solution of the agents profit-optimisation problem.
Regional Multi Agent Simulator 2011-06-19